VSTT calculates a number of statistics for each trial.
These are displayed in the application, are provided in the statistics Pandas DataFrame,
and are also contained in the excel data export.
Here we provide the definitions used to calculate them.
The cursor location at a timestamp is given by a pair of \((x, y)\) coordinates,
where \((0, 0)\) corresponds to the center of the screen,
and 1 in these units is equal to the height of the screen.
Given \(n\) pairs of \((x, y)\) cursor locations, labelled in order from \(1\) to \(n\),
the following statistics are calculated, all in units of screen height:
The cursor location at a timestamp is given by a pair of \((x, y)\) coordinates,
where \((0, 0)\) corresponds to the center of the screen, and 1 in these units is equal to the height of the screen.
Given pairs of \((x, y)\) cursor locations, the following statistics are calculated, all in units of screen height:
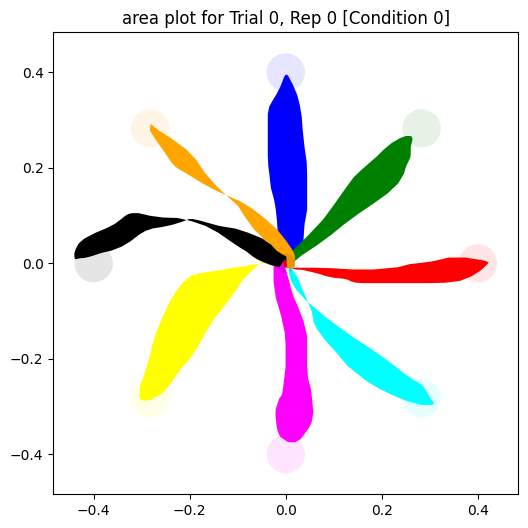
Area
get the cursor coordinates of the polygon which is closed by the to target and to center \((x, y)\) cursor locations, use the build-in function to calculate the area of the polygon.
In cases where the cursor movement results in intersecting paths, multiple polygons are formed, and their areas are summed.
Moreover, when the movement not only intersects but also leads to overlapping regions, the overlapped area is counted twice.
e.g.
Normalized Area
(the area formed by paths) / (length of the paths)²
The cursor location at a timestamp is given by a pair of \((x, y)\) coordinates,
where \((0, 0)\) corresponds to the center of the screen, and 1 in these units is equal to the height of the screen per second.
Given pairs of \((x, y)\) cursor locations, and pairs of \(t\) timestamp, the following statistics are calculated, all in units of screen height per second:
The cursor location at a timestamp is given by a pair of \((x, y)\) coordinates,
where \((0, 0)\) corresponds to the center of the screen, and 1 in these units is equal to the screen height per second squared.
Given pairs of \((x, y)\) cursor locations, and pairs of \(t\) timestamp, the following statistics are calculated, all in units of screen height per second squared:
The cursor location at a timestamp is given by a pair of \((x, y)\) coordinates,
where \((0, 0)\) corresponds to the center of the screen, and 1 in these units is equal to the screen height.
Given pairs of \((x, y)\) cursor locations,the following statistics are calculated, all in units of screen height:
Spatial Error to target
the distance between the end point of the movement to the center of the target - radius of target
Spatial Error to central target
the distance between the end point of the movement to the center of the central target - radius of central target
The cursor location at a timestamp is given by a pair of \((x, y)\) coordinates,
where \((0, 0)\) corresponds to the center of the screen, and 1 in these units is equal to the screen height.
Given pairs of \((x, y)\) cursor locations,the following statistics are calculated, all in units of screen height:
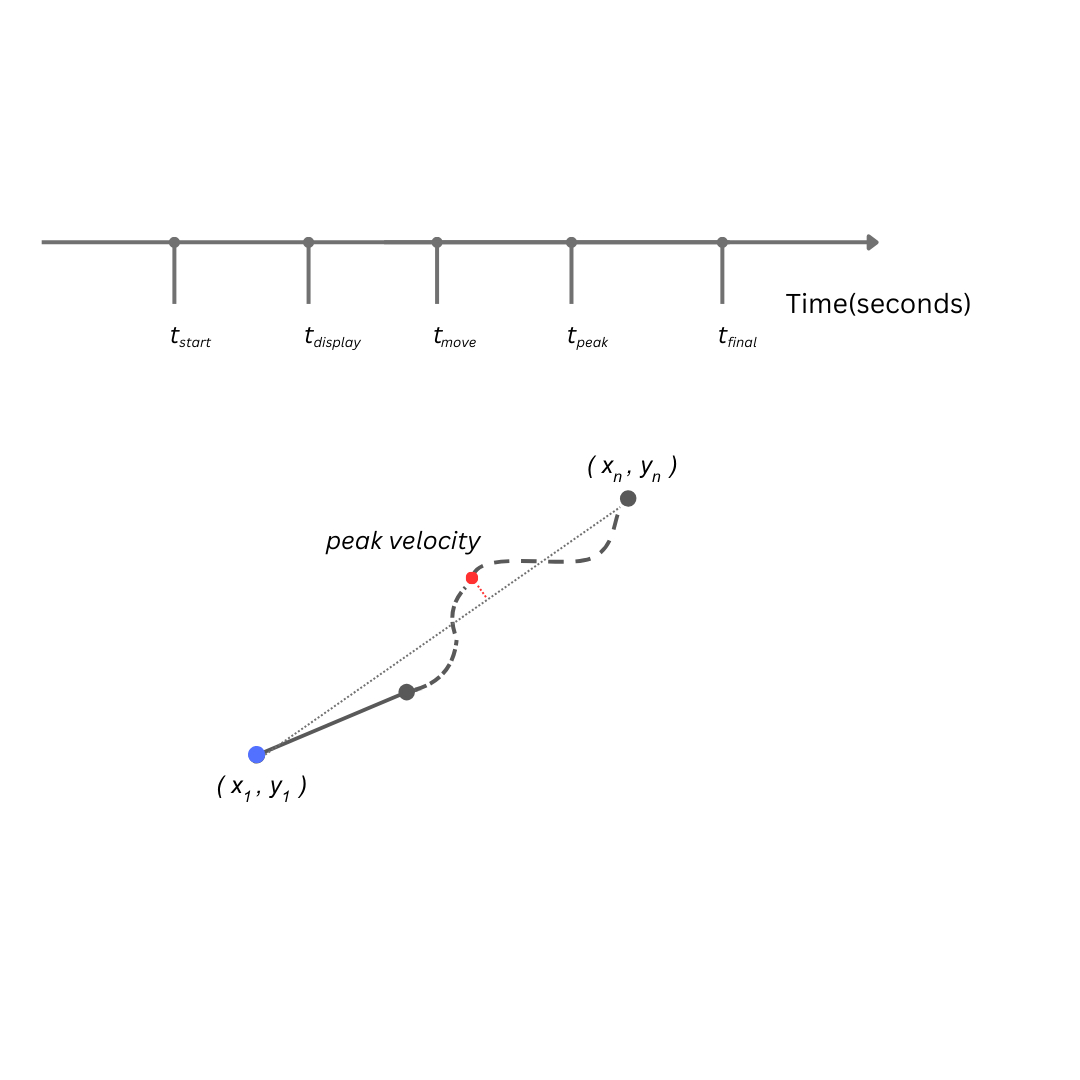
Movement time
\(t_{peak} - t_{move}\)
Time from first cursor movement to the movement at peak velocity
Total time
\(t_{peak} - t_{display}\)
Time from target being displayed to the movement at peak velocity
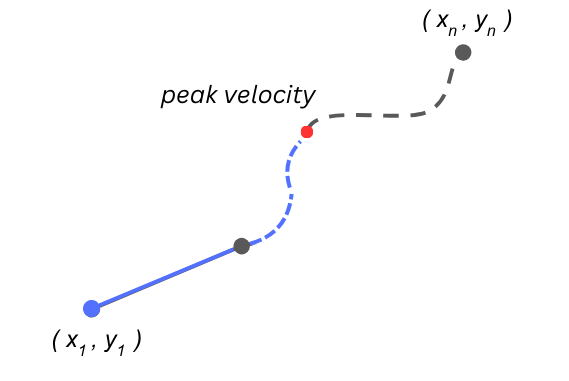
Movement distance
Euclidean point-to-point distance travelled from first cursor movement to the peak velocity
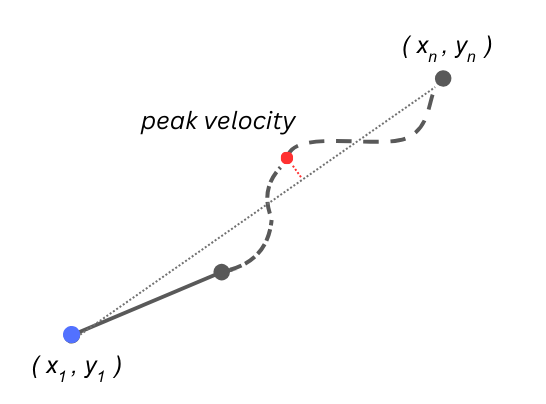
RMSE movement
Root Mean Square Error (RMSE) of the perpendicular distance from the peak velocity mouse point to the straight line that intersects the first mouse location and the target.