Analysing your results
[1]:
import matplotlib.pyplot as plt
import pandas as pd

import vstt
/home/docs/checkouts/readthedocs.org/user_builds/vstt/envs/stable/lib/python3.11/site-packages/psychopy/preferences/preferences.py:11: UserWarning: pkg_resources is deprecated as an API. See https://setuptools.pypa.io/en/latest/pkg_resources.html. The pkg_resources package is slated for removal as early as 2025-11-30. Refrain from using this package or pin to Setuptools<81.
  from pkg_resources import parse_version
pygame 2.6.1 (SDL 2.28.4, Python 3.11.12)
Hello from the pygame community. https://www.pygame.org/contribute.html
Import
To import an experiment from a psydat file:
[2]:
experiment = vstt.Experiment("example.psydat")
WARNING:root:Key 'turn_target_to_green_when_reached' missing, using default 'False'
WARNING:root:Key 'turn_target_to_green_when_reached' missing, using default 'False'
WARNING:root:Key 'area' missing, using default 'False'
WARNING:root:Key 'normalized_area' missing, using default 'False'
WARNING:root:Key 'peak_velocity' missing, using default 'False'
WARNING:root:Key 'peak_acceleration' missing, using default 'False'
WARNING:root:Key 'to_target_spatial_error' missing, using default 'False'
WARNING:root:Key 'to_center_spatial_error' missing, using default 'False'
WARNING:root:Key 'movement_time_at_peak_velocity' missing, using default 'False'
WARNING:root:Key 'total_time_at_peak_velocity' missing, using default 'False'
WARNING:root:Key 'movement_distance_at_peak_velocity' missing, using default 'False'
WARNING:root:Key 'rmse_movement_at_peak_velocity' missing, using default 'False'
Conditions
The trial conditions are in trial_list, each element in this list is a dict of trial conditions that defines a trial:
[3]:
experiment.trial_list
[3]:
[{'weight': 2,
  'condition_timeout': 0.0,
  'num_targets': 8,
  'target_order': 'clockwise',
  'target_indices': '0 1 2 3 4 5 6 7',
  'add_central_target': True,
  'hide_target_when_reached': True,
  'turn_target_to_green_when_reached': False,
  'show_target_labels': False,
  'target_labels': '0 1 2 3 4 5 6 7',
  'fixed_target_intervals': False,
  'target_duration': 5.0,
  'central_target_duration': 5.0,
  'pre_target_delay': 0.0,
  'pre_central_target_delay': 0.0,
  'pre_first_target_extra_delay': 0.0,
  'target_distance': 0.4,
  'target_size': 0.04,
  'central_target_size': 0.02,
  'show_inactive_targets': True,
  'ignore_incorrect_targets': True,
  'play_sound': True,
  'use_joystick': False,
  'joystick_max_speed': 0.02,
  'show_cursor': True,
  'cursor_size': 0.02,
  'show_cursor_path': True,
  'automove_cursor_to_center': False,
  'freeze_cursor_between_targets': False,
  'cursor_rotation_degrees': 0.0,
  'post_trial_delay': 0.0,
  'post_trial_display_results': False,
  'post_block_delay': 0.0,
  'post_block_display_results': True,
  'show_delay_countdown': True,
  'enter_to_skip_delay': True},
 {'weight': 2,
  'condition_timeout': 0.0,
  'num_targets': 6,
  'target_order': 'random',
  'target_indices': '2 3 0 4 5 1',
  'add_central_target': True,
  'hide_target_when_reached': True,
  'turn_target_to_green_when_reached': False,
  'show_target_labels': False,
  'target_labels': '0 1 2 3 4 5 6 7',
  'fixed_target_intervals': False,
  'target_duration': 5.0,
  'central_target_duration': 5.0,
  'pre_target_delay': 1.0,
  'pre_central_target_delay': 0.0,
  'pre_first_target_extra_delay': 0.0,
  'target_distance': 0.4,
  'target_size': 0.04,
  'central_target_size': 0.02,
  'show_inactive_targets': True,
  'ignore_incorrect_targets': True,
  'play_sound': True,
  'use_joystick': False,
  'joystick_max_speed': 0.02,
  'show_cursor': True,
  'cursor_size': 0.02,
  'show_cursor_path': True,
  'automove_cursor_to_center': True,
  'freeze_cursor_between_targets': True,
  'cursor_rotation_degrees': 0.0,
  'post_trial_delay': 0.0,
  'post_trial_display_results': False,
  'post_block_delay': 0.0,
  'post_block_display_results': True,
  'show_delay_countdown': True,
  'enter_to_skip_delay': True}]
This can be more easily viewed if converted to a pandas DataFrame:
[4]:
pd.DataFrame(experiment.trial_list)
[4]:
| weight | condition_timeout | num_targets | target_order | target_indices | add_central_target | hide_target_when_reached | turn_target_to_green_when_reached | show_target_labels | target_labels | ... | show_cursor_path | automove_cursor_to_center | freeze_cursor_between_targets | cursor_rotation_degrees | post_trial_delay | post_trial_display_results | post_block_delay | post_block_display_results | show_delay_countdown | enter_to_skip_delay | |
|---|---|---|---|---|---|---|---|---|---|---|---|---|---|---|---|---|---|---|---|---|---|
| 0 | 2 | 0.0 | 8 | clockwise | 0 1 2 3 4 5 6 7 | True | True | False | False | 0 1 2 3 4 5 6 7 | ... | True | False | False | 0.0 | 0.0 | False | 0.0 | True | True | True |
| 1 | 2 | 0.0 | 6 | random | 2 3 0 4 5 1 | True | True | False | False | 0 1 2 3 4 5 6 7 | ... | True | True | True | 0.0 | 0.0 | False | 0.0 | True | True | True |
2 rows × 36 columns
The weight of a trial is how many times it should be repeated.
Results
The results of the trials are in stats which provides both the raw data and calculated statistics as a pandas DataFrame:
[5]:
stats = experiment.stats
[6]:
stats.head()
[6]:
| i_trial | i_rep | i_target | condition_index | target_index | target_pos | target_radius | to_target_timestamps | to_target_mouse_positions | to_target_success | ... | to_center_rmse | to_center_spatial_error | area | normalized_area | peak_velocity | peak_acceleration | movement_time_at_peak_velocity | total_time_at_peak_velocity | movement_distance_at_peak_velocity | rmse_movement_at_peak_velocity | |
|---|---|---|---|---|---|---|---|---|---|---|---|---|---|---|---|---|---|---|---|---|---|
| 0 | 0 | 0 | 0 | 0 | 0 | [0.0, 0.4] | 0.04 | [0.016512155532836914, 0.03316307067871094, 0.... | [[0.0, 0.0], [0.0, 0.0], [0.0, 0.0], [0.0, 0.0... | True | ... | 0.033841 | 0 | 0.023840 | 0.034475 | 2.223369 | 76.701244 | 0.269374 | 0.602779 | 0.257532 | 0.036990 |
| 1 | 0 | 0 | 1 | 0 | 1 | [0.282842712474619, 0.28284271247461906] | 0.04 | [1.269320011138916, 1.2859880924224854, 1.3026... | [[0.013888888888888888, 0.0032407407407407406]... | True | ... | 0.017958 | 0 | 0.016878 | 0.026436 | 2.546450 | 119.925339 | 0.733372 | 0.750040 | 0.626939 | 0.021135 |
| 2 | 0 | 0 | 2 | 0 | 2 | [0.4, 2.4492935982947065e-17] | 0.04 | [2.1527011394500732, 2.16939115524292, 2.18605... | [[-0.0032407407407407406, 0.008796296296296297... | True | ... | 0.030604 | 0 | 0.012411 | 0.014747 | 3.017843 | 90.854791 | 0.249999 | 0.266689 | 0.217018 | 0.015429 |
| 3 | 0 | 0 | 3 | 0 | 3 | [0.28284271247461906, -0.282842712474619] | 0.04 | [3.1360599994659424, 3.1527769565582275, 3.169... | [[0.014351851851851852, -0.012037037037037037]... | True | ... | 0.040075 | 0 | 0.015122 | 0.018269 | 3.348506 | 94.232559 | 0.266654 | 0.283371 | 0.086299 | 0.026286 |
| 4 | 0 | 0 | 4 | 0 | 4 | [4.898587196589413e-17, -0.4] | 0.04 | [4.052838087081909, 4.0694849491119385, 4.0861... | [[-0.0125, 0.01712962962962963], [-0.017592592... | True | ... | 0.038653 | 0 | 0.018386 | 0.025205 | 2.846187 | 96.380859 | 0.750033 | 0.766680 | 0.507352 | 0.061012 |
5 rows × 37 columns
each row in this DataFrame contains the data from a single movement to a target (and optionally back to the center)
they are in the order that they were shown in the experiment
condition_indexis the index of the corresponding trial conditions intrial_index
[7]:
stats.describe()
[7]:
| i_trial | i_rep | i_target | condition_index | target_index | target_radius | to_target_num_timestamps_before_visible | center_radius | to_center_num_timestamps_before_visible | to_target_distance | ... | to_center_rmse | to_center_spatial_error | area | normalized_area | peak_velocity | peak_acceleration | movement_time_at_peak_velocity | total_time_at_peak_velocity | movement_distance_at_peak_velocity | rmse_movement_at_peak_velocity | |
|---|---|---|---|---|---|---|---|---|---|---|---|---|---|---|---|---|---|---|---|---|---|
| count | 28.000000 | 28.0 | 28.000000 | 28.000000 | 28.000000 | 28.00 | 28.000000 | 28.00 | 28.0 | 28.000000 | ... | 16.000000 | 28.0 | 28.000000 | 28.000000 | 28.000000 | 28.000000 | 28.000000 | 27.000000 | 28.000000 | 28.000000 |
| mean | 1.357143 | 0.0 | 3.071429 | 0.428571 | 3.071429 | 0.04 | 25.464286 | 0.02 | 0.0 | 0.414450 | ... | 0.030781 | 0.0 | 0.014558 | 0.019241 | 2.746698 | 88.582911 | 0.349513 | 0.407524 | 0.236214 | 0.030708 |
| std | 1.129218 | 0.0 | 2.159022 | 0.503953 | 2.159022 | 0.00 | 29.944989 | 0.00 | 0.0 | 0.050779 | ... | 0.017339 | 0.0 | 0.007793 | 0.009220 | 0.651132 | 23.619614 | 0.290741 | 0.276798 | 0.213964 | 0.024542 |
| min | 0.000000 | 0.0 | 0.000000 | 0.000000 | 0.000000 | 0.04 | 0.000000 | 0.02 | 0.0 | 0.364467 | ... | 0.007777 | 0.0 | 0.003810 | 0.006553 | 1.761711 | 55.124790 | 0.000000 | 0.099994 | 0.000000 | 0.000000 |
| 25% | 0.000000 | 0.0 | 1.000000 | 0.000000 | 1.000000 | 0.04 | 0.000000 | 0.02 | 0.0 | 0.381896 | ... | 0.018277 | 0.0 | 0.009981 | 0.013583 | 2.234549 | 73.140230 | 0.195854 | 0.241679 | 0.085500 | 0.015340 |
| 50% | 1.000000 | 0.0 | 3.000000 | 0.000000 | 3.000000 | 0.04 | 0.000000 | 0.02 | 0.0 | 0.397624 | ... | 0.031392 | 0.0 | 0.012561 | 0.018035 | 2.671863 | 82.988582 | 0.266655 | 0.283350 | 0.156280 | 0.021695 |
| 75% | 2.000000 | 0.0 | 5.000000 | 1.000000 | 5.000000 | 0.04 | 59.000000 | 0.02 | 0.0 | 0.420149 | ... | 0.039008 | 0.0 | 0.017399 | 0.022368 | 3.192919 | 96.768431 | 0.362553 | 0.501398 | 0.261430 | 0.040291 |
| max | 3.000000 | 0.0 | 7.000000 | 1.000000 | 7.000000 | 0.04 | 60.000000 | 0.02 | 0.0 | 0.562351 | ... | 0.077367 | 0.0 | 0.035034 | 0.042204 | 4.206990 | 136.721870 | 1.166727 | 1.183390 | 0.841735 | 0.091925 |
8 rows × 29 columns
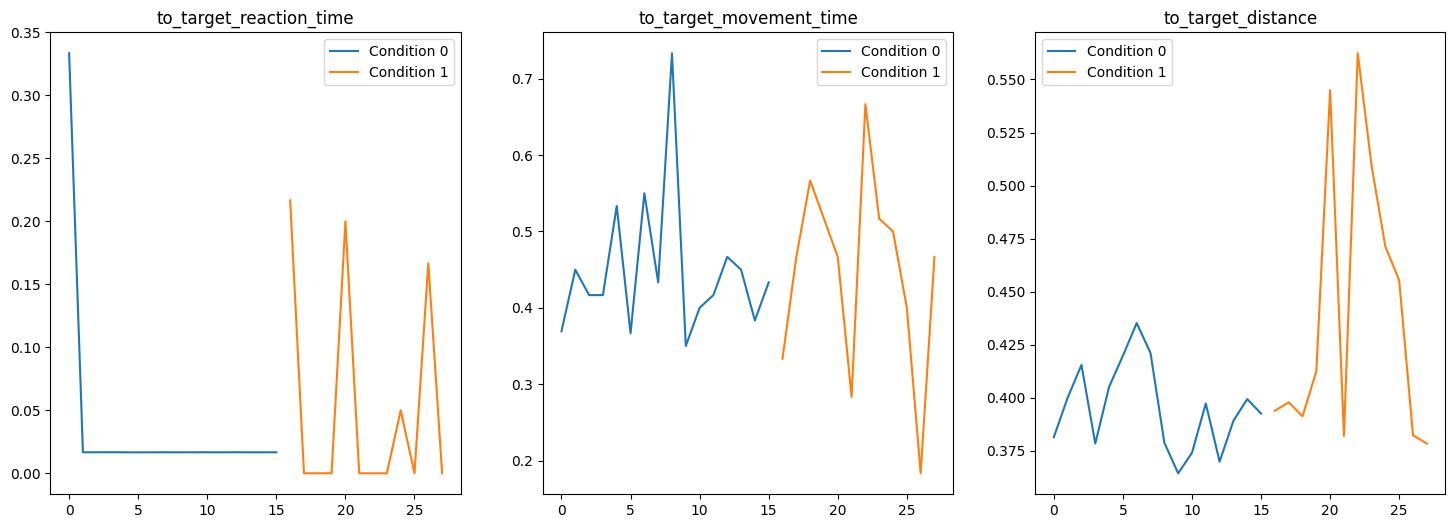
Plot statistics
Here we plot a few of the calculated statics for each target, identifying each set of conditions with a different color:
[8]:
fig, axs = plt.subplots(ncols=3, figsize=(18, 6))
for ax, statistic in zip(
    axs, ["to_target_reaction_time", "to_target_movement_time", "to_target_distance"]
):
    ax.set_title(f"{statistic}")
    for condition_index, df in stats.groupby("condition_index"):
        ax.plot(df.index, df[statistic], label=f"Condition {condition_index}")
    ax.legend()
plt.show()
[ ]: