Working directly with psydat files
The recommended way to analyse your data in Python is to use the provided pandas DataFrame of data and statistics.
However, if you need to you can access the raw data from which these DataFrames are constructed directly as shown in the examples below.
[1]:
import matplotlib.pyplot as plt
import numpy as np
import pandas as pd
from psychopy.misc import fromFile
from shapely.geometry import LineString
from shapely.geometry import Polygon
from shapely.ops import polygonize
from shapely.ops import unary_union
/home/docs/checkouts/readthedocs.org/user_builds/vstt/envs/stable/lib/python3.11/site-packages/psychopy/preferences/preferences.py:11: UserWarning: pkg_resources is deprecated as an API. See https://setuptools.pypa.io/en/latest/pkg_resources.html. The pkg_resources package is slated for removal as early as 2025-11-30. Refrain from using this package or pin to Setuptools<81.
  from pkg_resources import parse_version
Import
A psydat file can be imported using the psychopy fromFile function:
[2]:
psydata = fromFile("example.psydat")
pygame 2.6.1 (SDL 2.28.4, Python 3.11.12)
Hello from the pygame community. https://www.pygame.org/contribute.html
Contents
This returns a Python object that contains all of the trial conditions and results as attributes. These attributes can be listed using the Python vars function:
[3]:
for var in vars(psydata):
    print(var, end=" | ")
name | autoLog | trialList | nReps | trialWeights | nTotal | nRemaining | method | thisRepN | thisTrialN | thisN | thisIndex | thisTrial | finished | extraInfo | seed | data | sequenceIndices | originPath | origin | _exp |
Conditions
The trial conditions are in trialList, each element in this list is a dict of trial conditions that defines a trial:
[4]:
psydata.trialList
[4]:
[{'weight': 2,
  'condition_timeout': 0.0,
  'num_targets': 8,
  'target_order': 'clockwise',
  'target_indices': '0 1 2 3 4 5 6 7',
  'add_central_target': True,
  'hide_target_when_reached': True,
  'show_target_labels': False,
  'target_labels': '0 1 2 3 4 5 6 7',
  'fixed_target_intervals': False,
  'target_duration': 5.0,
  'central_target_duration': 5.0,
  'pre_target_delay': 0.0,
  'pre_central_target_delay': 0.0,
  'pre_first_target_extra_delay': 0.0,
  'target_distance': 0.4,
  'target_size': 0.04,
  'central_target_size': 0.02,
  'show_inactive_targets': True,
  'ignore_incorrect_targets': True,
  'play_sound': True,
  'use_joystick': False,
  'joystick_max_speed': 0.02,
  'show_cursor': True,
  'cursor_size': 0.02,
  'show_cursor_path': True,
  'automove_cursor_to_center': False,
  'freeze_cursor_between_targets': False,
  'cursor_rotation_degrees': 0.0,
  'post_trial_delay': 0.0,
  'post_trial_display_results': False,
  'post_block_delay': 0.0,
  'post_block_display_results': True,
  'show_delay_countdown': True,
  'enter_to_skip_delay': True},
 {'weight': 2,
  'condition_timeout': 0.0,
  'num_targets': 6,
  'target_order': 'random',
  'target_indices': '2 5 3 0 1 4',
  'add_central_target': True,
  'hide_target_when_reached': True,
  'show_target_labels': False,
  'target_labels': '0 1 2 3 4 5 6 7',
  'fixed_target_intervals': False,
  'target_duration': 5.0,
  'central_target_duration': 5.0,
  'pre_target_delay': 1.0,
  'pre_central_target_delay': 0.0,
  'pre_first_target_extra_delay': 0.0,
  'target_distance': 0.4,
  'target_size': 0.04,
  'central_target_size': 0.02,
  'show_inactive_targets': True,
  'ignore_incorrect_targets': True,
  'play_sound': True,
  'use_joystick': False,
  'joystick_max_speed': 0.02,
  'show_cursor': True,
  'cursor_size': 0.02,
  'show_cursor_path': True,
  'automove_cursor_to_center': True,
  'freeze_cursor_between_targets': True,
  'cursor_rotation_degrees': 0.0,
  'post_trial_delay': 0.0,
  'post_trial_display_results': False,
  'post_block_delay': 0.0,
  'post_block_display_results': True,
  'show_delay_countdown': True,
  'enter_to_skip_delay': True}]
This can be more easily viewed if converted to a pandas DataFrame:
[5]:
pd.DataFrame(psydata.trialList)
[5]:
| weight | condition_timeout | num_targets | target_order | target_indices | add_central_target | hide_target_when_reached | show_target_labels | target_labels | fixed_target_intervals | ... | show_cursor_path | automove_cursor_to_center | freeze_cursor_between_targets | cursor_rotation_degrees | post_trial_delay | post_trial_display_results | post_block_delay | post_block_display_results | show_delay_countdown | enter_to_skip_delay | |
|---|---|---|---|---|---|---|---|---|---|---|---|---|---|---|---|---|---|---|---|---|---|
| 0 | 2 | 0.0 | 8 | clockwise | 0 1 2 3 4 5 6 7 | True | True | False | 0 1 2 3 4 5 6 7 | False | ... | True | False | False | 0.0 | 0.0 | False | 0.0 | True | True | True |
| 1 | 2 | 0.0 | 6 | random | 2 5 3 0 1 4 | True | True | False | 0 1 2 3 4 5 6 7 | False | ... | True | True | True | 0.0 | 0.0 | False | 0.0 | True | True | True |
2 rows × 35 columns
The weight of a trial is how many times it should be repeated. This information is also stored in the trialWeights list, so for example trialList[i] will be repeated trialWeights[i] times
[6]:
psydata.trialWeights
[6]:
[2, 2]
A block consists of doing a trial with each condition in trialList weight times, where weight can be a different number for each trial, so the total number of trials done in a block is then given by
This block is then repeared nReps times:
[7]:
psydata.nReps
[7]:
1
The total number of trials nTotal is then given by
[8]:
psydata.nTotal
[8]:
4
The condition used for a given trial iTrial and repetition number iRep is given by sequenceIndices[iTrial][iRep], which gives the index of the conditions used in the trialList list:
[9]:
psydata.sequenceIndices
[9]:
array([[0],
       [0],
       [1],
       [1]])
The method specifies the order in which the trials were done:
sequential
the same order as
trialList
random
order of trials shuffled within each block
fullRandom
order of trials fully shuffled
[10]:
psydata.method
[10]:
'sequential'
Results
The results of the trials are in data which contains a dict of numpy arrays of recorded data:
[11]:
for key, value in psydata.data.items():
    print(key, value.shape)
ran (4, 1)
order (4, 1)
target_indices (4, 1)
target_pos (4, 1)
to_target_timestamps (4, 1)
to_target_num_timestamps_before_visible (4, 1)
to_center_timestamps (4, 1)
to_center_num_timestamps_before_visible (4, 1)
to_target_mouse_positions (4, 1)
to_center_mouse_positions (4, 1)
to_target_success (4, 1)
to_center_success (4, 1)
[12]:
colors = ["blue", "green", "red", "cyan", "magenta", "yellow", "black", "orange"]
nTrials, nReps = psydata.sequenceIndices.shape


def get_axs_row():
    row = 0
    for condition in range(len(psydata.trialList)):
        if not psydata.trialList[condition]["automove_cursor_to_center"]:
            row += 2 * psydata.trialWeights[condition]
        else:
            row += psydata.trialWeights[condition]
    return row


def get_fig_height():
    add = 0
    for condition in range(len(psydata.trialList)):
        if not psydata.trialList[condition]["automove_cursor_to_center"]:
            add += psydata.trialWeights[condition]
    return 6 * (nTrials + add) * nReps


fig, axs = plt.subplots(get_axs_row(), nReps, figsize=(6, get_fig_height()))
axs = np.reshape(
    axs, (get_axs_row(), nReps)
)  # ensure axs is a 2d-array even if nTrials or nReps is 1
for trial in range(nTrials):
    for rep in range(nReps):
        loc = (trial, rep)
        condition = psydata.sequenceIndices[loc]
        target_radius = psydata.trialList[condition]["target_size"]
        central_target_radius = psydata.trialList[condition]["central_target_size"]
        ax = axs[loc]
        ax.set_title(f"Trial {trial}, Rep {rep} [Condition {condition}]")
        for positions, target_pos, color in zip(
            psydata.data["to_target_mouse_positions"][loc],
            psydata.data["target_pos"][loc],
            colors,
        ):
            ax.plot(positions[:, 0], positions[:, 1], color=color)
            ax.add_patch(
                plt.Circle(
                    target_pos,
                    target_radius,
                    edgecolor="none",
                    facecolor=color,
                    alpha=0.1,
                )
            )

        # if condition "automove_cursor_to_center" is deselected, plot the line to center, fill the enclosed area and output the area
        if not psydata.trialList[condition]["automove_cursor_to_center"]:
            loc_area = (trial + nTrials, rep)
            ax_area = axs[loc_area]
            ax_area.set_xbound(-0.5, 0.5)
            ax_area.set_ybound(-0.5, 0.5)
            ax_area.set_title(
                f"area plot for Trial {trial}, Rep {rep} [Condition {condition}]"
            )
            print("---------------------------------------------")
            print(f"area of Trial {trial}, Rep {rep} [Condition {condition}]")
            for (
                to_target_mouse_positions,
                to_center_mouse_positions,
                target_pos,
                color,
            ) in zip(
                psydata.data["to_target_mouse_positions"][loc],
                psydata.data["to_center_mouse_positions"][loc],
                psydata.data["target_pos"][loc],
                colors,
            ):
                ax.plot(
                    to_center_mouse_positions[:, 0],
                    to_center_mouse_positions[:, 1],
                    color=color,
                )
                coords = np.concatenate(
                    (to_target_mouse_positions, to_center_mouse_positions)
                )
                polygon = Polygon(coords)
                lr_coords = np.concatenate((coords[:], to_target_mouse_positions[0:1]))
                lr = LineString(lr_coords)
                validation = lr.is_valid
                multi_LineString = unary_union(lr)
                area = 0
                for pg in polygonize(multi_LineString):
                    area += pg.area
                    ax_area.plot(*pg.exterior.xy, color=color)
                    ax_area.fill(*pg.exterior.xy, facecolor=color)
                ax_area.add_patch(
                    plt.Circle(
                        target_pos,
                        target_radius,
                        edgecolor="none",
                        facecolor=color,
                        alpha=0.1,
                    )
                )
                print(f"{color}, area: {area}")

            ax.add_patch(
                plt.Circle(
                    [0, 0],
                    central_target_radius,
                    edgecolor="none",
                    facecolor="black",
                    alpha=0.1,
                )
            )

plt.show()
---------------------------------------------
area of Trial 0, Rep 0 [Condition 0]
blue, area: 0.02384012774348422
green, area: 0.016878322187928677
red, area: 0.01241100823045268
cyan, area: 0.015122099828252057
magenta, area: 0.01838616683813443
yellow, area: 0.026584183527663462
black, area: 0.01402879923061912
orange, area: 0.009765195843465515
---------------------------------------------
area of Trial 1, Rep 0 [Condition 0]
blue, area: 0.012710585484282402
green, area: 0.022543002158882722
red, area: 0.008019782096372857
cyan, area: 0.008811416635490702
magenta, area: 0.014736532418141348
yellow, area: 0.014034243031060156
black, area: 0.011178626543209877
orange, area: 0.004766468942901244

Each of these is a nTrials x nReps 2d array, where each element of this array contains the results from the corresponding trial for this variable (which might itself be a single value, e.g. target_pos, or an array of values, e.g. timestamps)
Which set of conditions was used is given by the sequenceIndices entry in the same location
Plot of results for each trial
For example, a scatter plot of the mouse positions for each trial, labelled by the condition, trial number and repetition number:
Plot of all trials combined for each condition
Here we instead make one plot for each set of conditions in trialList, and super-impose all of the corresponding results:
[13]:
colors = ["blue", "green", "red", "cyan", "magenta", "yellow", "black", "orange"]
nConditions = len(psydata.trialList)
nTrials, nReps = psydata.sequenceIndices.shape
fig, axs = plt.subplots(nConditions, 1, figsize=(6, 6 * nConditions))
axs = np.reshape(axs, (nConditions))  # ensure axs is a 1d-array
for trial in range(nTrials):
    for rep in range(nReps):
        loc = (trial, rep)
        condition = psydata.sequenceIndices[loc]
        target_radius = psydata.trialList[condition]["target_size"]
        ax = axs[condition]
        ax.set_title(f"Condition {condition}")
        for positions, target_pos, color in zip(
            psydata.data["to_target_mouse_positions"][loc],
            psydata.data["target_pos"][loc],
            colors,
        ):
            ax.plot(positions[:, 0], positions[:, 1], color=color)
            ax.add_patch(
                plt.Circle(
                    target_pos,
                    target_radius,
                    edgecolor="none",
                    facecolor=color,
                    alpha=0.1,
                )
            )
plt.show()

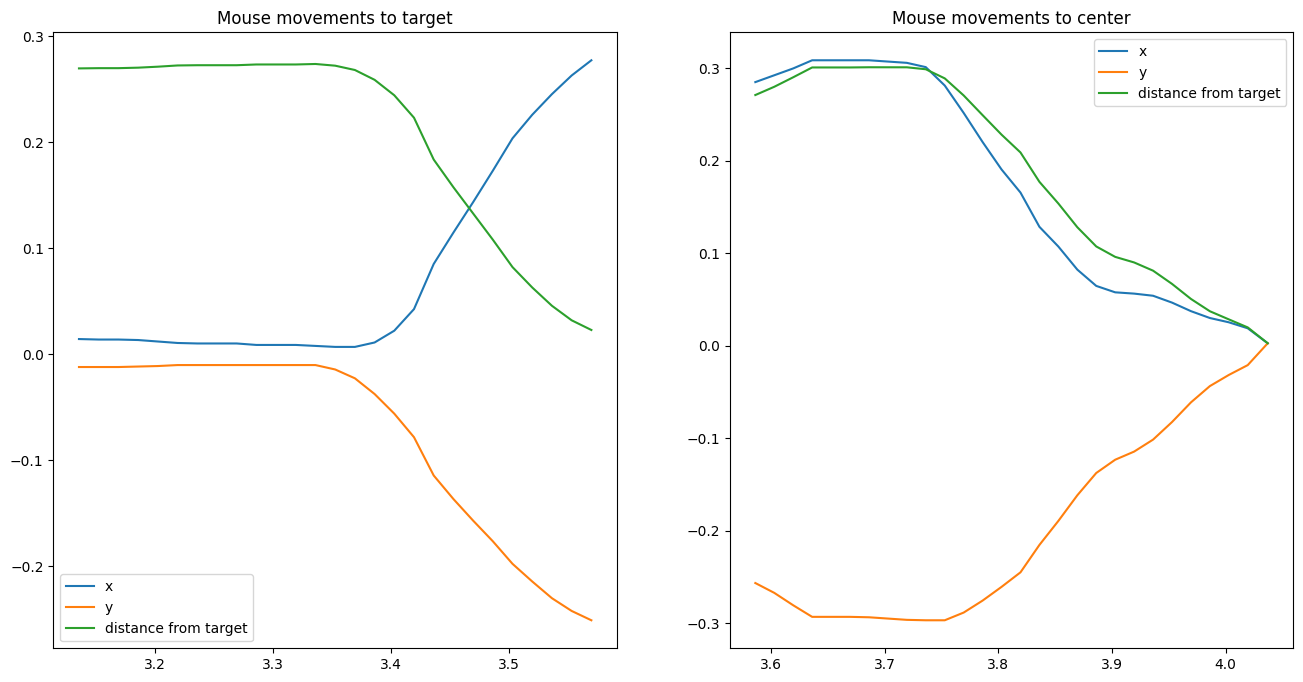
Plot of mouse movements vs time
A plot of x, y, and distance from target versus time for a single move to/from a target
[14]:
def dist(xys, xy0):
    return np.sqrt(np.mean(np.power(xys - xy0, 2), axis=1))


fig, axs = plt.subplots(1, 2, figsize=(16, 8))

trial = 0
rep = 0
i_target = 3
loc = (trial, rep)
condition = psydata.sequenceIndices[loc]
target_radius = psydata.trialList[condition]["target_size"]
central_target_radius = psydata.trialList[condition]["central_target_size"]
for dest, ax in zip(["target", "center"], axs):
    positions = psydata.data[f"to_{dest}_mouse_positions"][loc][i_target]
    target = psydata.data["target_pos"][loc][i_target] if dest == "target" else [0, 0]
    times = psydata.data[f"to_{dest}_timestamps"][loc][i_target]
    ax.set_title(f"Mouse movements to {dest}")
    ax.plot(times, positions[:, 0], label="x")
    ax.plot(times, positions[:, 1], label="y")
    ax.plot(times, dist(positions, target), label="distance from target")
    ax.legend()
plt.show()